21.01.2026

·

5 Min Lesezeit

Zentrale Erkenntnisse

  • EPDs zeigen mehr als nur CO₂. Während das Treibhauspotenzial (GWP) meist im Fokus steht, bedeutet echte Nachhaltigkeit, auch andere Wirkungskategorien wie Wasserverbrauch, Luftverschmutzung und Ressourcenabbau zu berücksichtigen.
  • Rohstoffgewinnung und Produktion sind oft die größten Treiber, doch auch Transport, Einbau, Nutzung und Entsorgung können je nach Produkt erhebliche Auswirkungen haben.
  • Nur durch die Analyse des gesamten Fußabdrucks können Hersteller, Planer und Bauherren die wirklich relevanten Umweltauswirkungen reduzieren – nicht nur das CO₂.

Wichtige Wirkungskategorien über Kohlenstoff hinaus

Diese Indikatoren stehen für die verschiedenen „Ausgabenkategorien“ in Ihrem Umweltbudget – jeder einzelne gibt einen Teil der Geschichte wieder.

  • Versauerungspotenzial (AP): Steht im Zusammenhang mit saurem Regen und Bodendegradation (mol H⁺ eq). Umfasst Emissionen wie SO₂ und NOₓ.
  • Photochemisches Ozonbildungspotenzial (POCP): Misst den Beitrag zu Smog und Luftverschmutzung in Städten (kg NMVOC-Äquivalent).
  • Ozonabbaupotenzial (ODP): Spiegelt die Schädigung der Ozonschicht wider (kg CFC-11-Äquivalent).
  • Abiotisches Verarmungspotenzial – Fossil (ADPF): Verfolgt die Nutzung fossiler Brennstoffressourcen (MJ).
  • Abiotisches Verarmungspotenzial – Elemente (ADPE): Misst die Verarmung nicht erneuerbarer Mineralien (kg Sb-Äquivalent).
  • Wassernutzung (z. B. Wasserentnahmepotenzial, WDP): Erfasst die Auswirkungen auf die Verfügbarkeit von Süßwasser und Ökosysteme (m³ entnommen).

Fazit: Niedrige Kohlenstoffemissionen bedeuten nicht immer geringe Auswirkungen. Ein Produkt kann zwar beim GWP gut abschneiden, aber dennoch erhebliche Auswirkungen auf die Versauerung, die Wasserknappheit oder andere Umweltbelastungen haben.

Existing EPD Database Landscape listing LCA and EPD tools such as Emidat, Sphera, LCA.no and others. It also shows the Program Operators such as IBU, EPD Global, and EPD Italy. The data is shared with Aggregators such as Eco Platform, and used by tools such as CAALA, 2050 Materials, and other providers

HOW IS MY PRODUCT DATA BEING USED?

We see two types of solutions addressing these problems to enable data use:

  1. Tech companies earning money on making the data usable

Focusing on the user side of the environmental product data, it is usually planning or procurement. In construction, there are several building-level LCA tools that are targeted to architects and project developers. They earn money to make the environmental data easy to use, they “consume” data from these databases. These solutions enable developers to demand higher prices for their buildings (e.g. through certifications like LEED, BREEAM, DGNB), receive more beneficial conditions in their bank loans (e.g. with QNG) or comply with national law (e.g. staying within CO2 thresholds in the Netherlands or Denmark). They are economically dependent on providing value to the end user.

  1. National databases with additional quality requirements

To ensure data quality, there are rigid national databases like the Ökobaudat (Germany) and the NMD (Netherlands), who only allow specific Program Operators to publish in them, often with additional requirements and quality checks. This makes sense, because these databases usually tie the environmental impact of products to financial incentives, so tender processes, interest rates of bank loans and large investment decisions depend on their accuracy. Their job is to make the environmental impact assessment of products comparable.

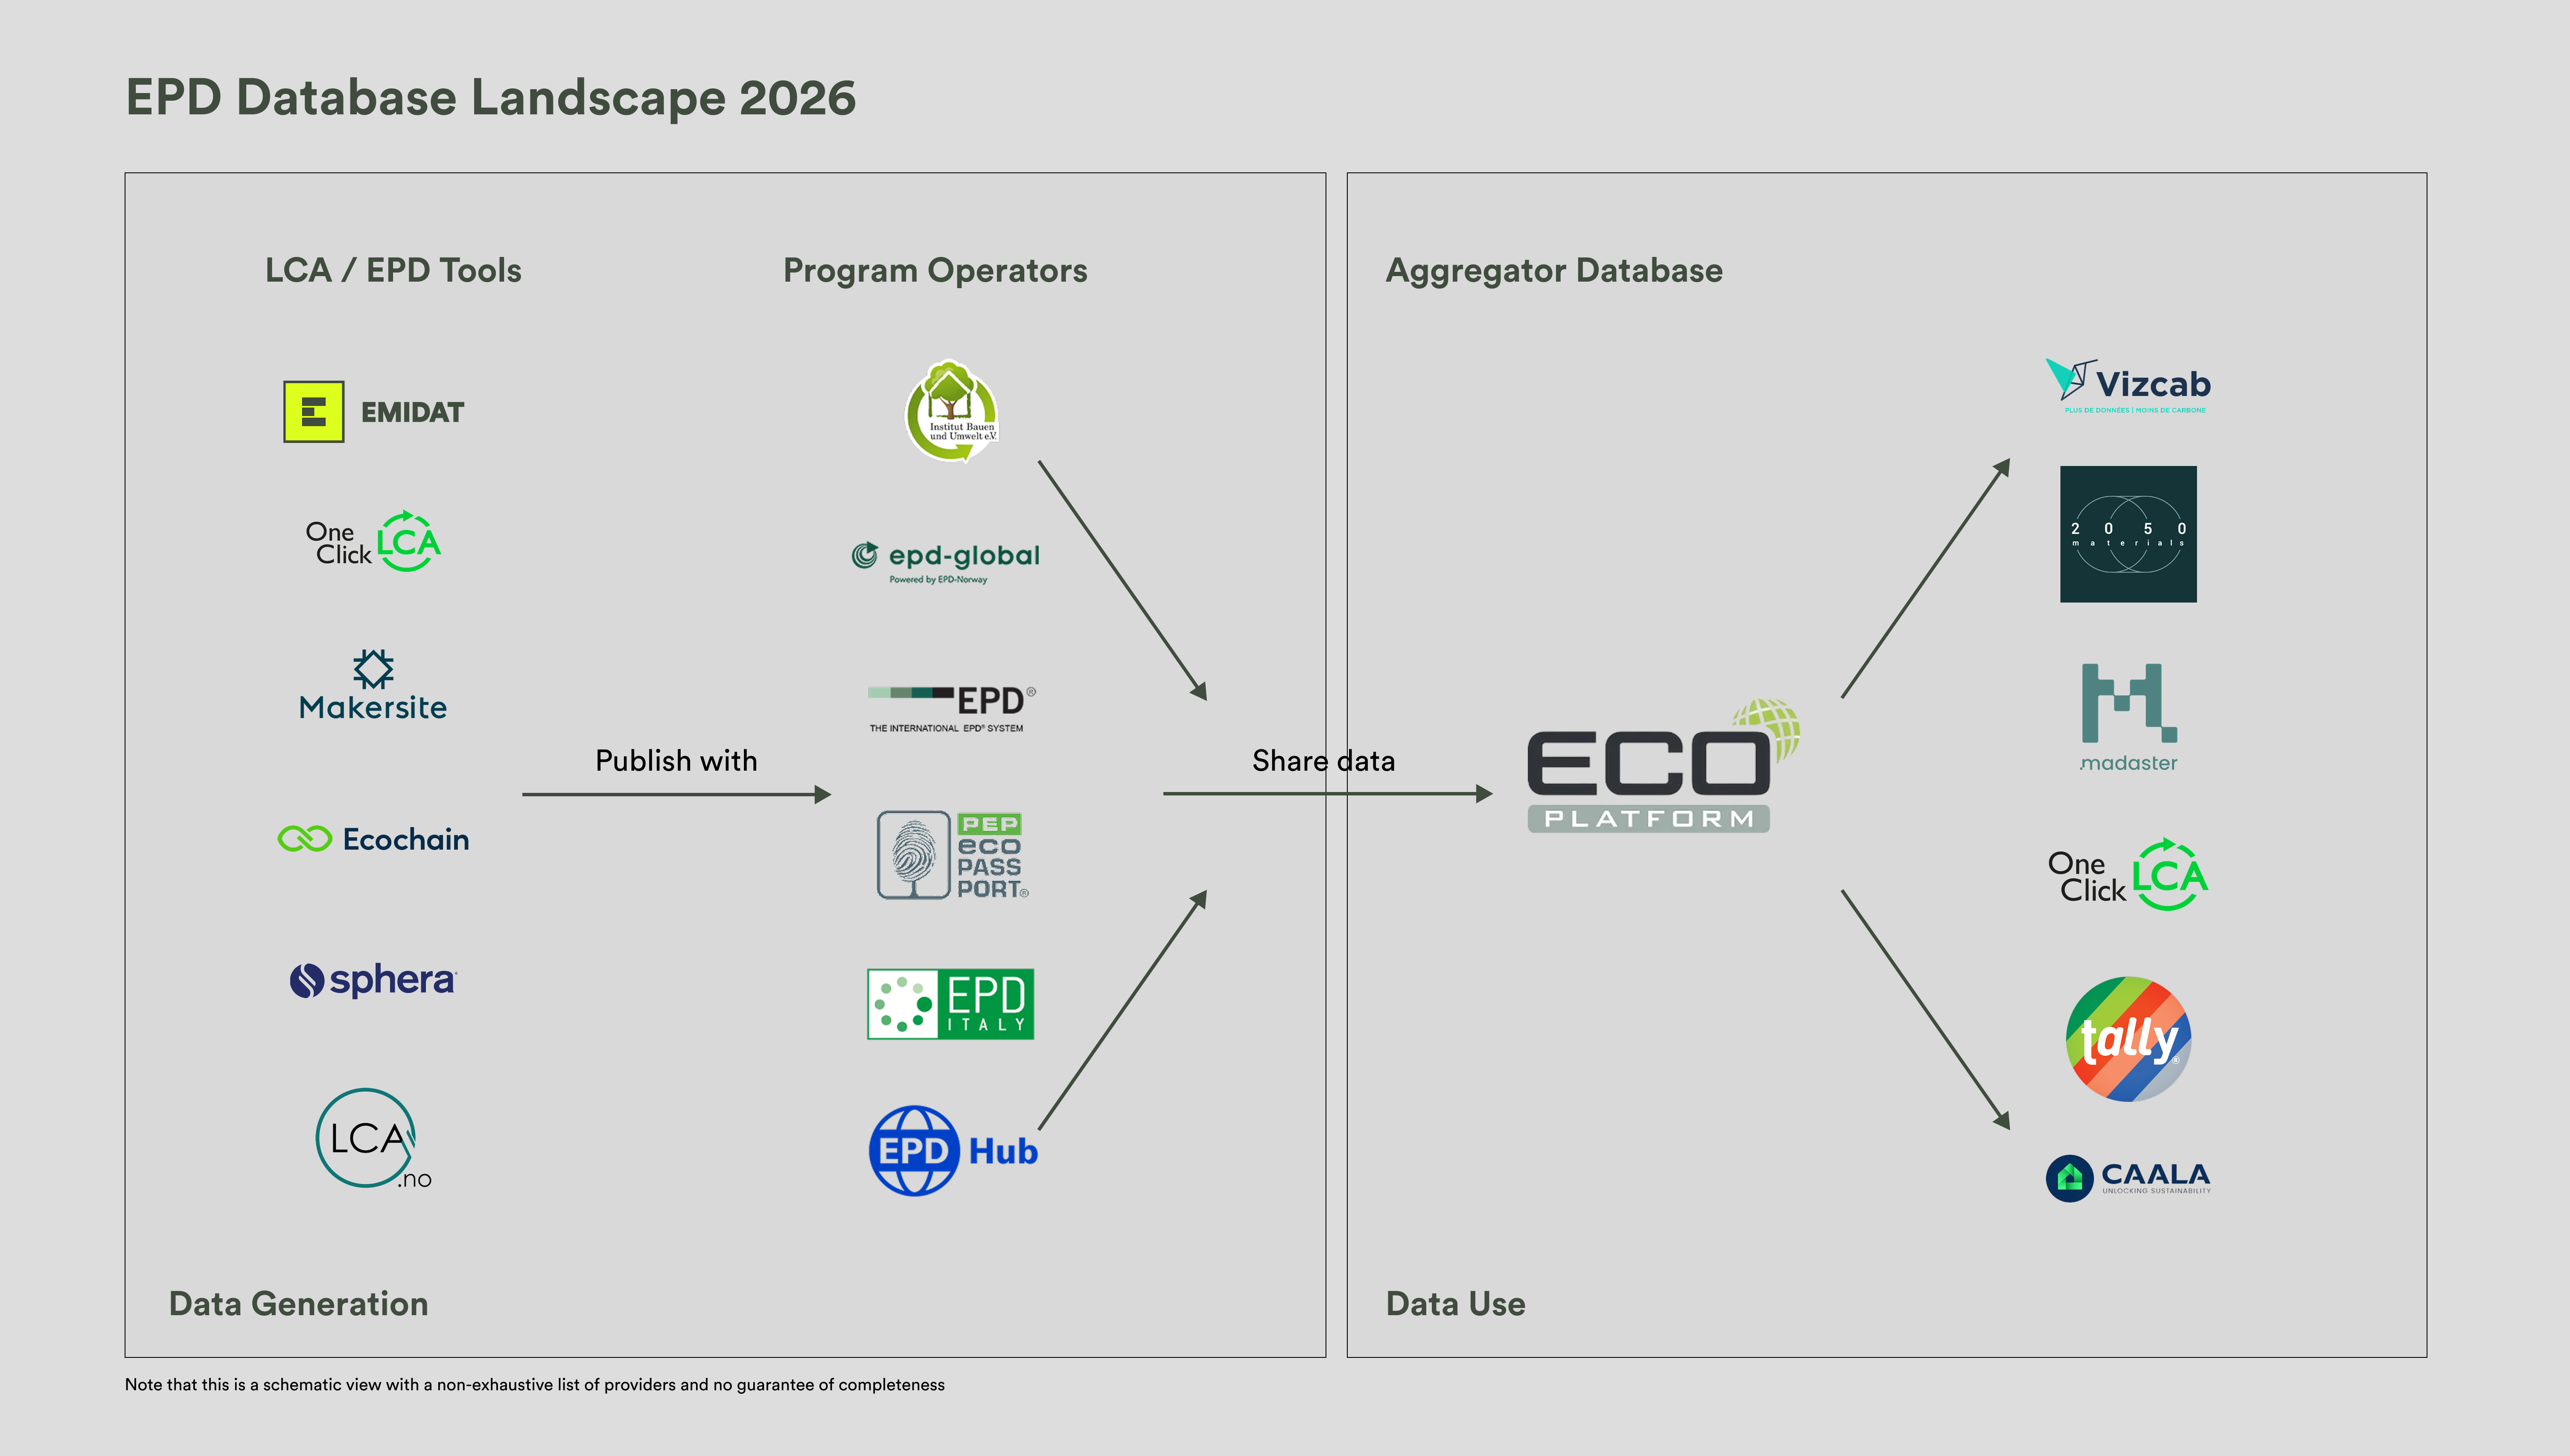
However, there is also criticism that this is against the idea of an open Single Market and at Emidat, we see this problem in practice everyday: A German producer selling to several European markets needs to redo their environmental data for France (publishing in INIES), the Netherlands (publishing in NMD) and the rest of Europe (publishing through EPD Global or EPD International to Eco-Platform). They pay three times for three different consultants and three different publishers to calculate the very same product, gathering documents but not relevant information to reduce. Yet they are forced to do so, because they cannot otherwise sell their product in the local markets.

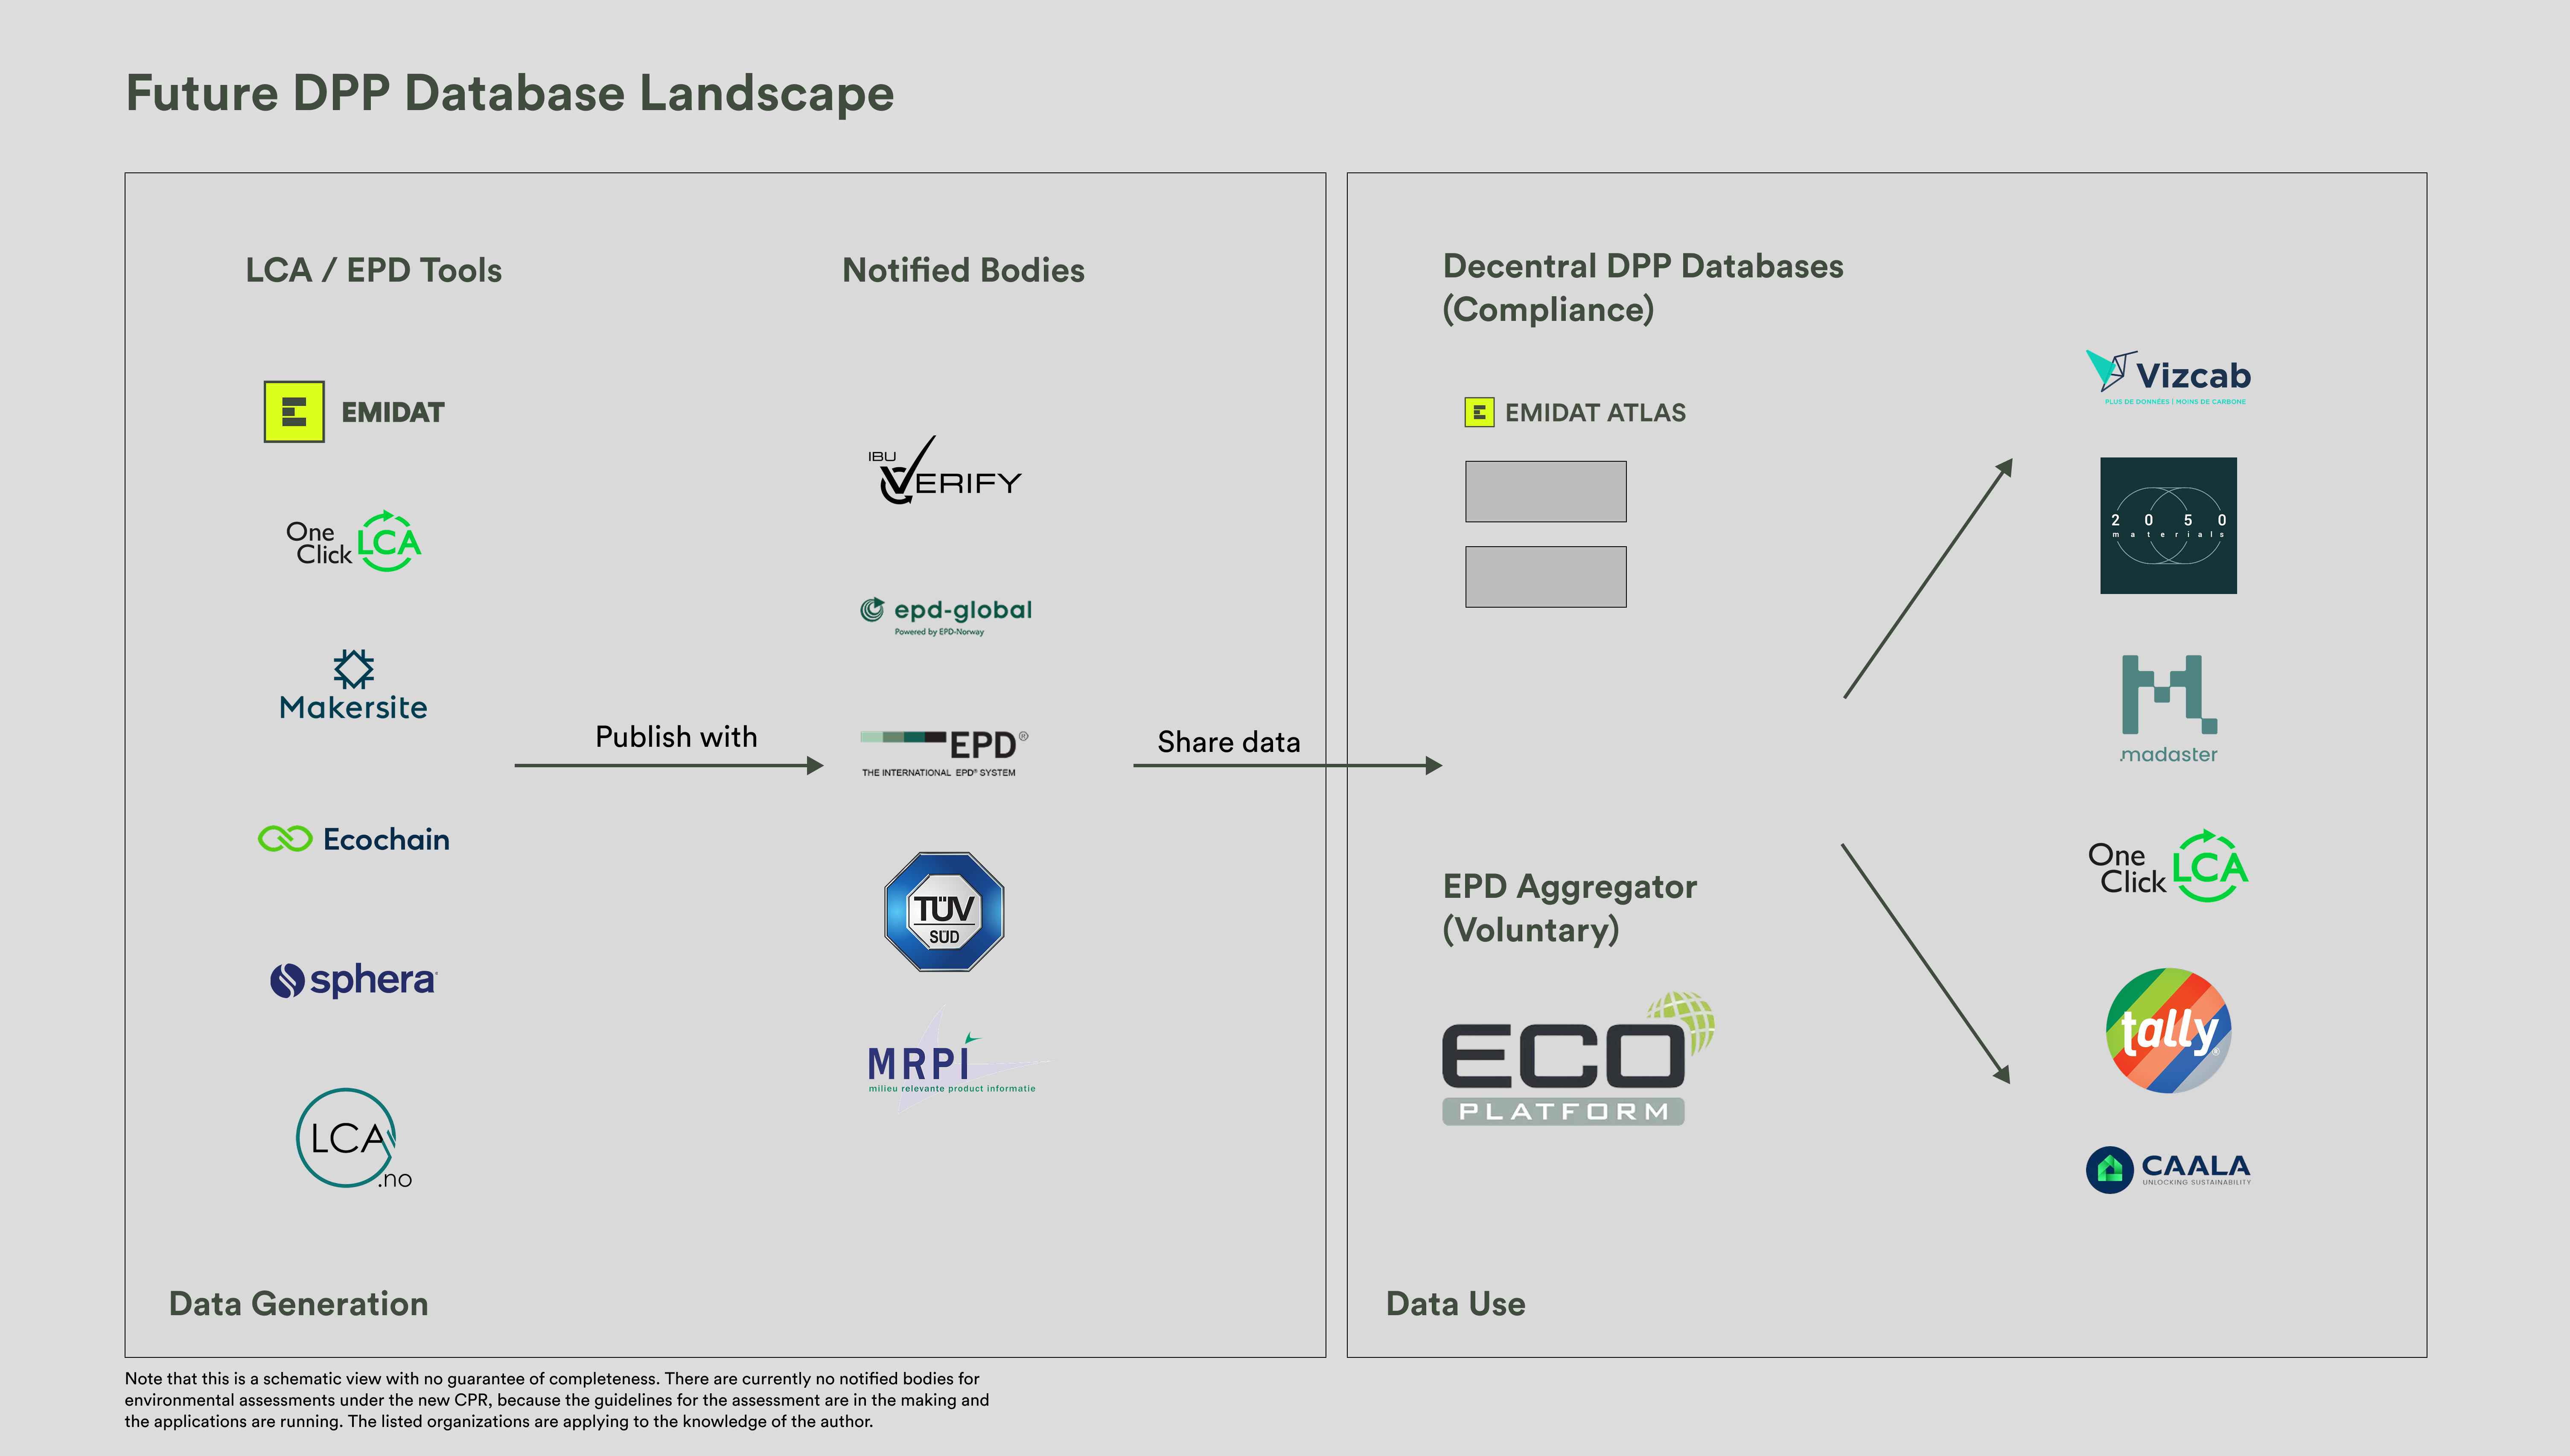
This is where the Construction Products Regulation (CPR) aims to harmonise standards across Europe. It aims to simplify and unify the environmental accounting that is already happening nationally today and to aggregate all product reporting in the digital product passport (DPP). If done well, this should actually reduce, not increase paperwork for manufacturers!

It’s the Bloomberg moment in environmental accounting.

How will the CPR change the database landscape?

It has already been communicated by the European Union, that they will not offer one central database for DPPs, but instead there will be several decentral databases by private providers that need to follow set guidelines and allow you to easily transfer data from one to another, so you can choose the one that suits your needs best. This is similar to mobile infrastructure providers: They host your phone number, but need to allow you to easily transfer it to another if you with to switch.

It is unclear which private providers will provide these databases in the future, but the Emidat Atlas will evolve into one of them.

Future DPP Database Landscape showing various LCA tools such as Emidat, Makersite, Sphera, amongst others. The landscape also shows examples of Notified Bodies such as EPD Global and EPD International. Next, DPP Databases such as Emidat Atlas, and data users such as CAALA and 20250 Materials are shown

INTRODUCING THE EMIDAT ATLAS

So sieht das in der Praxis aus: Dieses Radardiagramm zeigt den ökologischen Fußabdruck eines Betonstahlprodukts. Trotz seines moderaten CO₂-Fußabdrucks (2,403 kg CO₂e/kg) weist das Produkt in Kategorien wie Wasserverschwendung, Versauerung und Verbrauch fossiler Brennstoffe erhebliche Auswirkungen auf.

Das Diagramm veranschaulicht, warum es wichtig ist, alle Wirkungskategorien zu analysieren, nicht nur CO₂. Ein Produkt, das in einem Bereich nachhaltig erscheint, kann dennoch an anderer Stelle im System Belastungen verursachen.

Um eine nachhaltige Produktgestaltung zu unterstützen, müssen wir den gesamten Lebenszyklus bewerten, hier dargestellt für die Phasen A1–A3 (Rohstoffgewinnung und Produktion), und den Blick bis zu den End-of-Life-Phasen erweitern, um ein vollständiges Bild zu erhalten.

what to look forward to next

We are now building the next wave of features that will make the platform even more powerful. A dedicated comparison view is on the way, more Program Operators are being added, and API access will open the door to deeper integrations. A chatbot will support common tasks and help users navigate the data more easily. If you want to be among the first to use these new releases, join the waitlist and follow the progress as each feature goes live.

Automatisieren Sie Ihre EPDs.
Kontaktiere UNS.

Mit dem Absenden dieses Formulars erklären Sie sich damit einverstanden, von uns per E-Mail kontaktiert zu werden & nehmen zur Kenntnis, dass Ihre Kontaktdaten bei uns gespeichert werden.

Thank you! Your submission has been received!
Oops! Something went wrong while submitting the form.